Detecting illegal mines from space


Matthias Werner


Rainforest of borneo

Throughout the globe, rain forests and other natural landscapes are endangered by illegal mining, which transforms areas formerly rich in flora and fauna into wasteland. In order for local governments to take countermeasures, they first need to know about the locations of illegal mines. In countries covered by vast areas of impenetrable rain forest, such as Brazil or Congo, obtaining this information is a difficult problem.

In this blog post I describe an approach to detect illegal mines based on deep learning and remote sensing, that we have developed to support the conservation efforts of governments and NGOs. In particular, we use a U-Net for semantic segmentation, a branch of computer vision.

As part of the project of automatic detection of illegal mines, we were also joined by scientists from the Institute of Mineral Resources Engineering of the RWTH Aachen University, who contributed their mining-specific expertise. The project was funded by the European Space Agency.


Outline of the task


Analyzing the potential harm related to different types of illegal mining, we found that both for environmental and workers' safety reasons artisanal and small-scale mines (ASM) are the most dangerous, as opposed to large-scale mines (LSM).

However, for obvious reasons ASMs are far more difficult to spot than LSMs.

Currently, mining experts currently rely on manual examinations of the area via Bing Maps and similar services to gauge the extent of ASM activities in a certain region. Since the analysis of the data is done manually by an expert, it is expensive and inefficient to analyze large areas.

We set ourselves the following goal: We wanted to develop a deep learning software to automatically identify ASMs on satellite imagery. The software could then be used to monitor mining-endangered areas continuously, allowing governments and NGOs to both shut down detected mines immediately and also gain more systematic insights into the prevalence and development of illegal mining, which can help to find long-term counter strategies.

We decided to base our research on satellite imagery from Suriname, where ASMs are especially prevalent.

The structure of ASM sites

 Image taken from M. Heemskerk, E. Negulic and C. Duijves.

ASMs typically employ a mining method called "hydraulic mining with sluice box":

  1. The miners loosen up the soil with high-pressure water.

  2. Soil and water are pumped through a suction hose into a sluice box. The sluice box has ripples and fabric so that the water runs over it and leaves the larger particles behind.

  3. The (toxic) waste is dumped into the environment.

More important than the details of the method is the fact that thereby ASMs have characteristic structures and features: They come as singles, tubes or clusters and are primarily indicated by the presence of sediment pools and a high evaporation rate.

These characteristics make it possible for a neural network to learn how an ASM looks like on satellite images, but also come with specific challenges: On satellite imagery, roads, buildings and forest clearings can look very similar to ASMs.


The deep learning approach


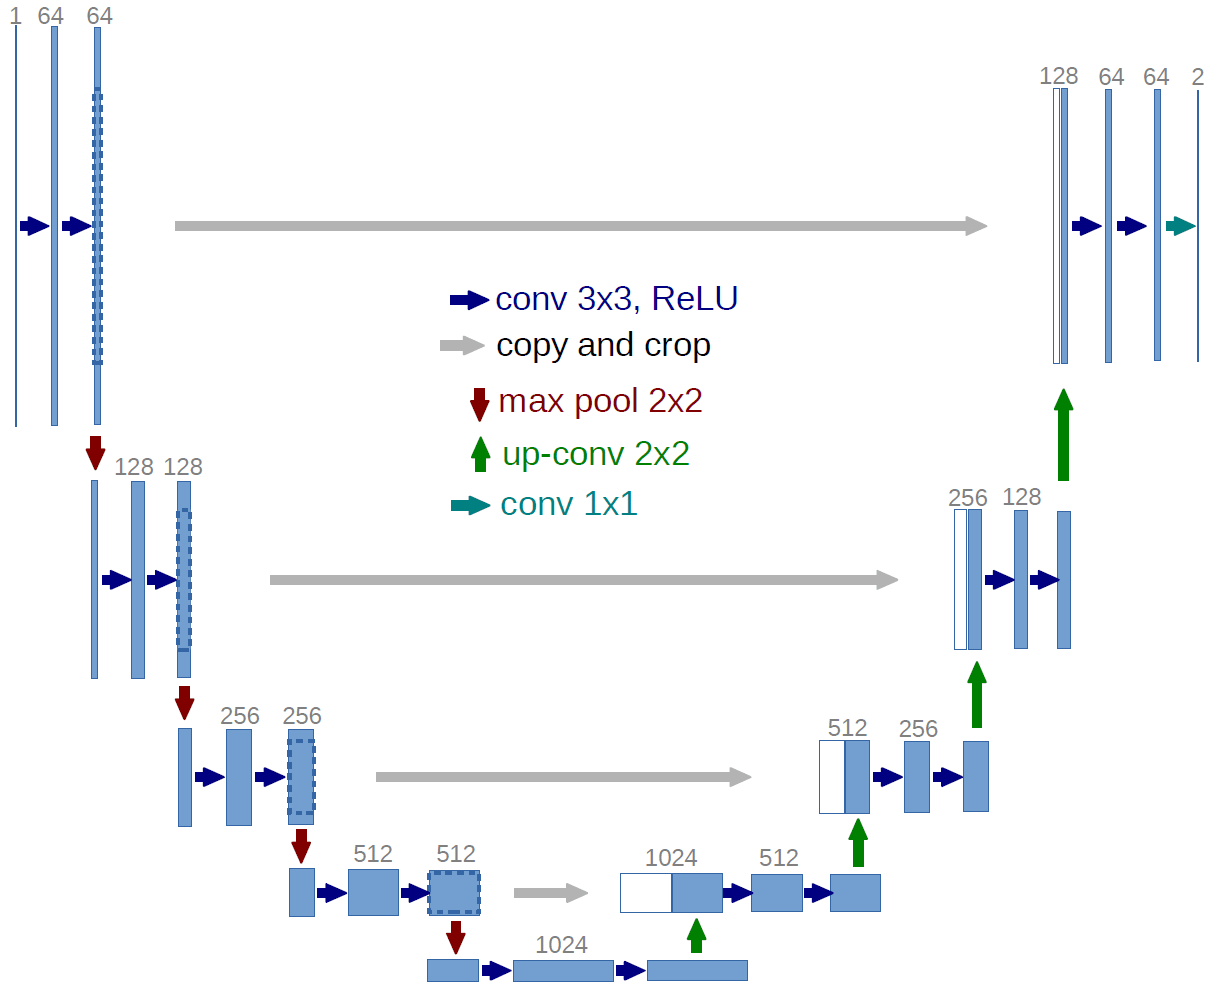
We decided to tackle the challenge as a semantic segmentation task, i.e. we wanted to develop a model that predicts for each pixel of a given satellite image whether it belongs to an ASM or not.

First of all, we had to get a labeled data set.

Data and labeling

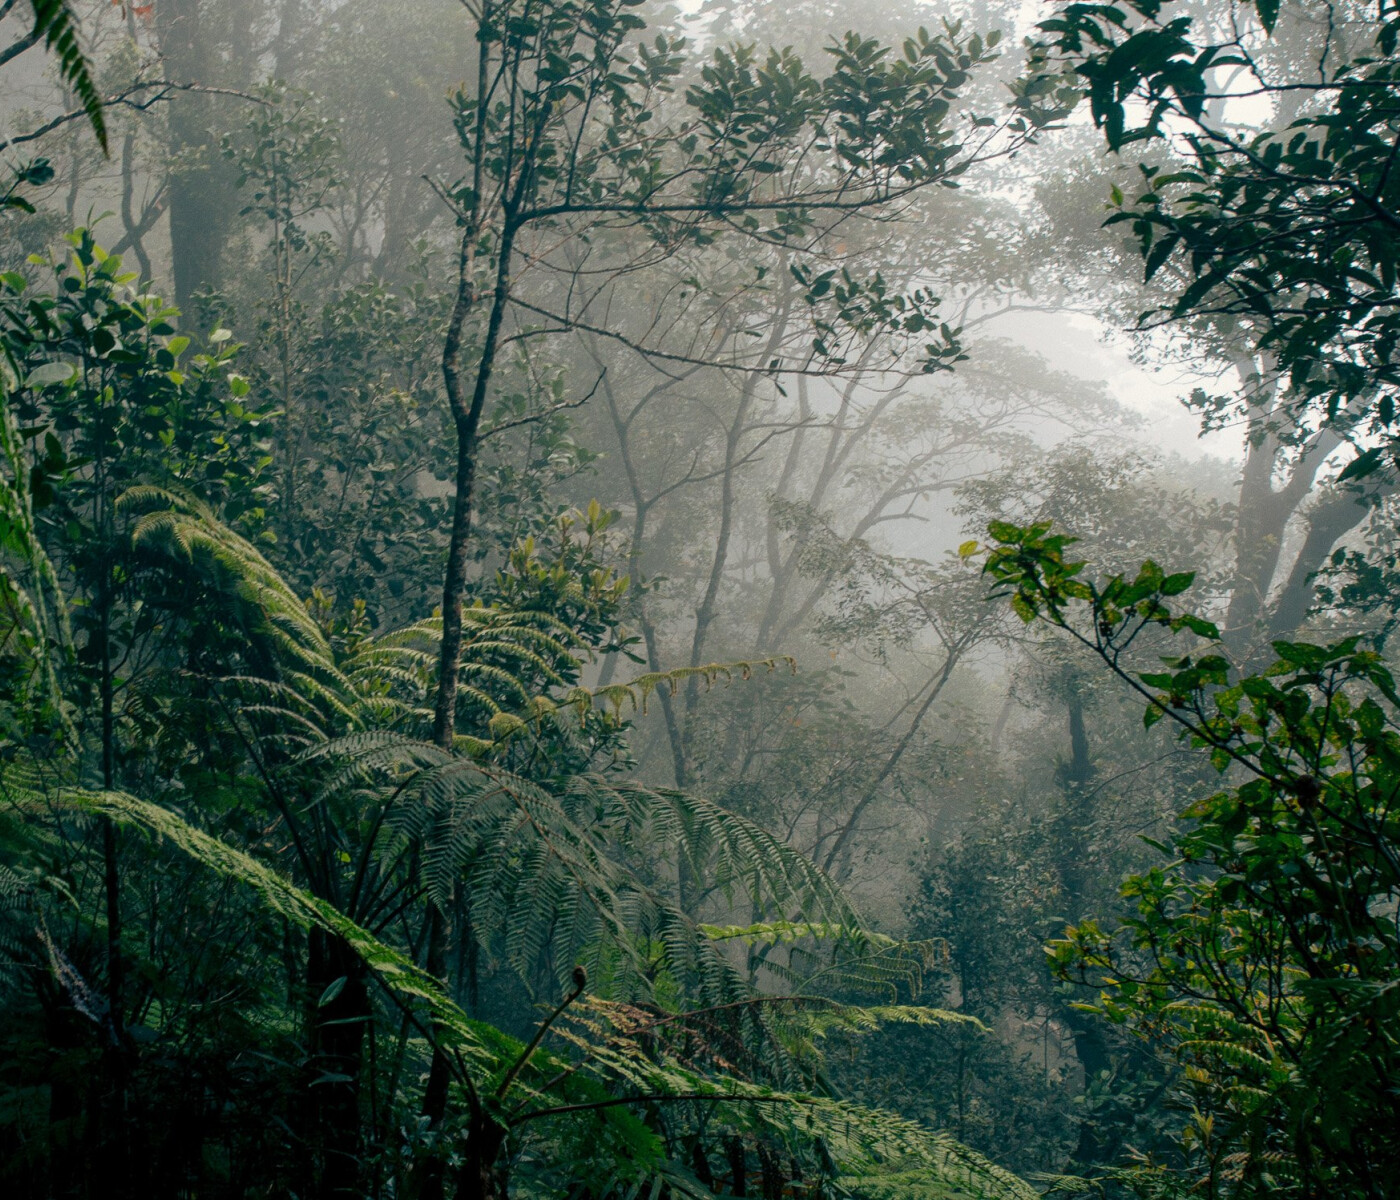
For training purposes, we used images from the Planet Scope satellite:

  • 3-4 meters resolution per pixel

  • four channels: RGB and near infrared (NIR)

In total, we identified and labeled ASM sites in ~100 satellite images. Because of the difficulty of the task the labels had to be provided by an expert from RWTH Aachen. Since the original images were huge, we chopped them into smaller patches before feeding them into the segmentation model, so that the training data set consisted of more than 15,000 labelled images, 256-by-256 pixels each.

To make both the annotator's and the model's job easier, we computed two more channels from the four already existing ones:

The normalized difference water index (NDWI) was computed as

$$NDWI = \frac{G - NIR}{G + NIR}$$

and it highlights areas of large water content. Here $$G$$ refers to the green channel from RGB. The NDWI is appended to the Planet Scope images as a fifth channel.

The normalized difference vegetation index (NDVI) was computed as

$$NDVI = \frac{NIR - R}{NIR + R}$$

and highlights vegetation in the images. As you might guess, $$R$$ is the red channel from RGB. NDVI is appended as the sixth channel to the input data.

It turned out that for labeling purposes it was beneficial to focus a gray-scale depiction of the NDWI.

Segmentation model

Now we had to develop a machine learning model that is able to learn the following task: Given an input satellite image, it returns a binary mask indicating the pixels that belong to an ASM area.

We decided to use a state-of-the-art, but by now already well-proven deep neural network architecture for semantic segmentation, the U-Net.

It consists of a convolutional encoder (the downward path on the left) followed by a decoding sequence of up-convolutions until the input size is regained (upward path on the right). Horizontal skip connections ensure that the encoded global information is augmented by detailed local information.

Here are some more details on the network architecture and the hyperparameters we used:

  • Architecture: U-Net with 3 recursions, 5x5 kernel and  2x2 max pooling

  • Loss: smooth Dice loss

  • Optimizer: Adam with learning rate 1e-3

  • Batch size: 32


Results


We evaluated the model's predictions with a pixel-based F1 score and observed that

$$F1 ≈ 0.79.$$

Looking at example images, this means that most of the time ASMs are detected quite reliably:

However, we found that the model is prone to overlook small mines (singles, in the terminology established above), since they look very similar to forest clearings.

Another issue are water bodies, in particular bays, which often get misclassified as ASMs. Again, the error can be explained by the shape of bays, which is similar to the shape of mines.


Additional learnings


  • We also tested the model trained on images from the rain forest in Suriname on regions of similar topological nature (such as the rain forest in Congo) and found that the results of the network were comparable with those from Suriname. It doesn't generalize well, though, to topologically very different landscapes, such as deserts and mountainous landscapes. This is hardly a surprise, because in these regions different mining methods are employed, giving rise to different visual characteristics of the mines.

  • We tried to improve the model's performance by using pre-training. This turned out to be less beneficial than expected, probably because the non-remote sensing pre-training tasks are too different from the actual task.

  • We learned not to underestimate spectral information.