Monitoring urban development from space


Johan Dettmar


2.6. red: footprint added between May 2013 and January 2019

Urbanisation on a global scale is happening at an ever increasing rate. In the year 2008, more than 50% of the worlds population lived in cities and it is predicted that by 2050 about 64% of the developing world and 86% of the developed world will be urbanised. This trend puts significant stress on infrastructure planning. Providing everything from sanitation, water systems and transportation to adequate housing for more than 1.1 billion new urbanites over the next 10 years will be an extraordinary challenge.

In a research project for the European Space Agency's program "AI for social impact", dida assessed the use of state-of-the-art computer vision methods for monitoring urban development over time of three rapidly growing cities in west Africa: Lagos, Accra and Luanda. The population of these cities are expected to grow by 30-55% in size by the end of 2030 which means that in-situ data collection about how these cities develop is almost impossible given the available resources. Instead, we came up with a concept that would rely solely on satellite images and machine learning.

 Urban development of Lagos, Nigeria between 2001 and 2012, images from Google Earth.

The Goal


The monitoring can be broken down into two parts: horizontal growth (expansion) and vertical growth (densification). Both of these tasks are achieved by predicting the horizontal spread and vertical elevation at different time steps in a sequence of satellite images. The change in between each prediction can then be visualised and highlighted. Both these tasks pose their own challenges and this post will try to highlight some of the techniques used to produce as accurate predictions as possible.


Model architectures


In order to train the models a supervised machine learning technique is used, meaning that both models are fed a large amount of input-output examples from which they can learn.

The horizontal segmentation task is done by a convolutional neural network (CNN) called U-Net. It has a proven track record of performing well in various contexts ranging from semantic segmentation of medical imaging to satellite images, both of which are described in detail in our previous blog posts and will therefore not get a further explanation here.

The vertical estimation task is done by a similar but in some crucial way different CNN, namely a CNN called Im2Height, which can transform a single monocular image into a height map. The similarity to the U-Net is that they both use residual connections between the convolutional and de-convolutional steps, but the Im2Height only carries one residual connection over between the first and last blocks while at the same time using a residual connection within each block. Another important difference is that the last layer, instead of performing a binary classification, performs a regression task which outputs the height in meters.


Data


Both models are trained on radar data from the TerraSAR-X satellite as input. The benefits of using radar data in comparison to visual spectrum images is that clouds and atmospheric pollution doesn't obscure the picture, which means that the area of interest could be captured at a higher temporal frequency.

 TerraSAR-X snapshot of south Lagos, Nigeria. Image by Airbus.

The data preprocessing pipeline is an important part of this project where satellite images from various sources must match perfectly for optimal performance in training. The pipeline contains numerous steps described in the diagram below.

The target data for the horizontal task is comprised of manually labelled binary masks. From these masks a weight map is calculated where weight at each pixel is dependent on the distance to the nearest border. This weight map is used to further emphasise correct predictions around borders.

The target data for the vertical estimation task comes from the TanDEM-X satellite and is a 12x12m per pixel, elevation map covering our three cities. To simplify the task, the model is asked to estimate the relative elevation of the objects in the image rather than their absolute elevation. This means that the model treats each image as if the lowest point in it is at 0m above sea level. Since we're only interested in relative change between different time steps anyway, this simplification is not a limitation, however for display purposes we re-add the base once a prediction is made.


Results


After training the U-Net to predict horizontal spread, it shows promising results with a F1-score on the train- and test set of ca 0.9 and 0.8 respectively. The visual results can be found in the gallery below.

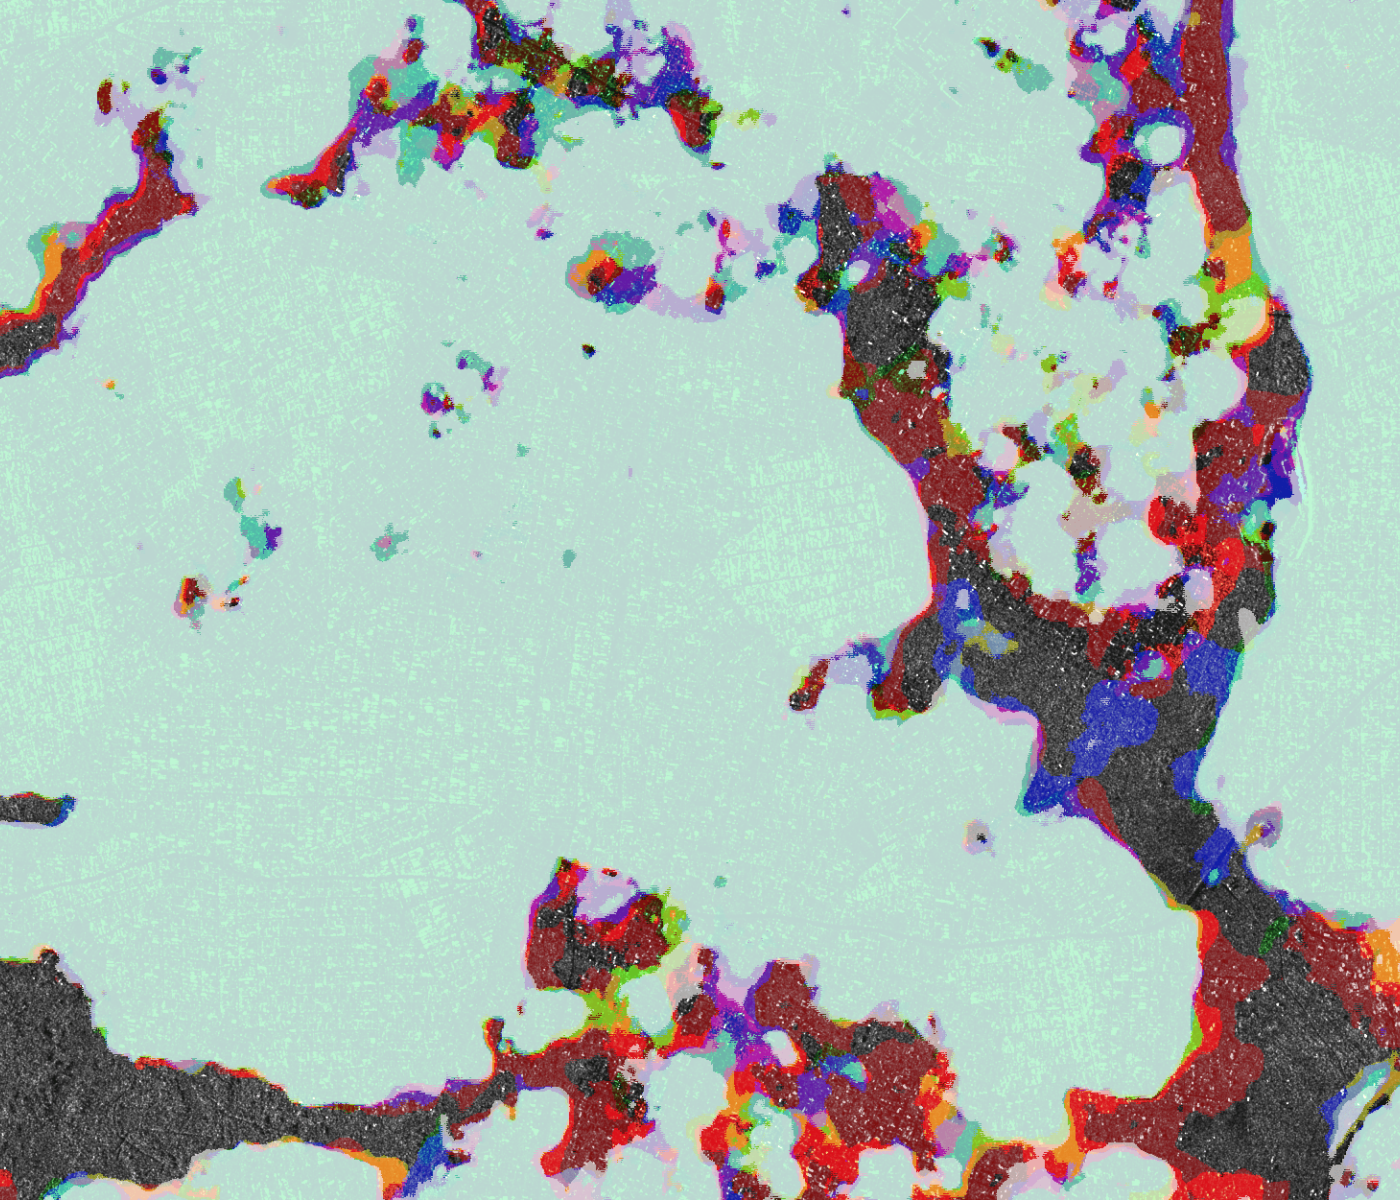
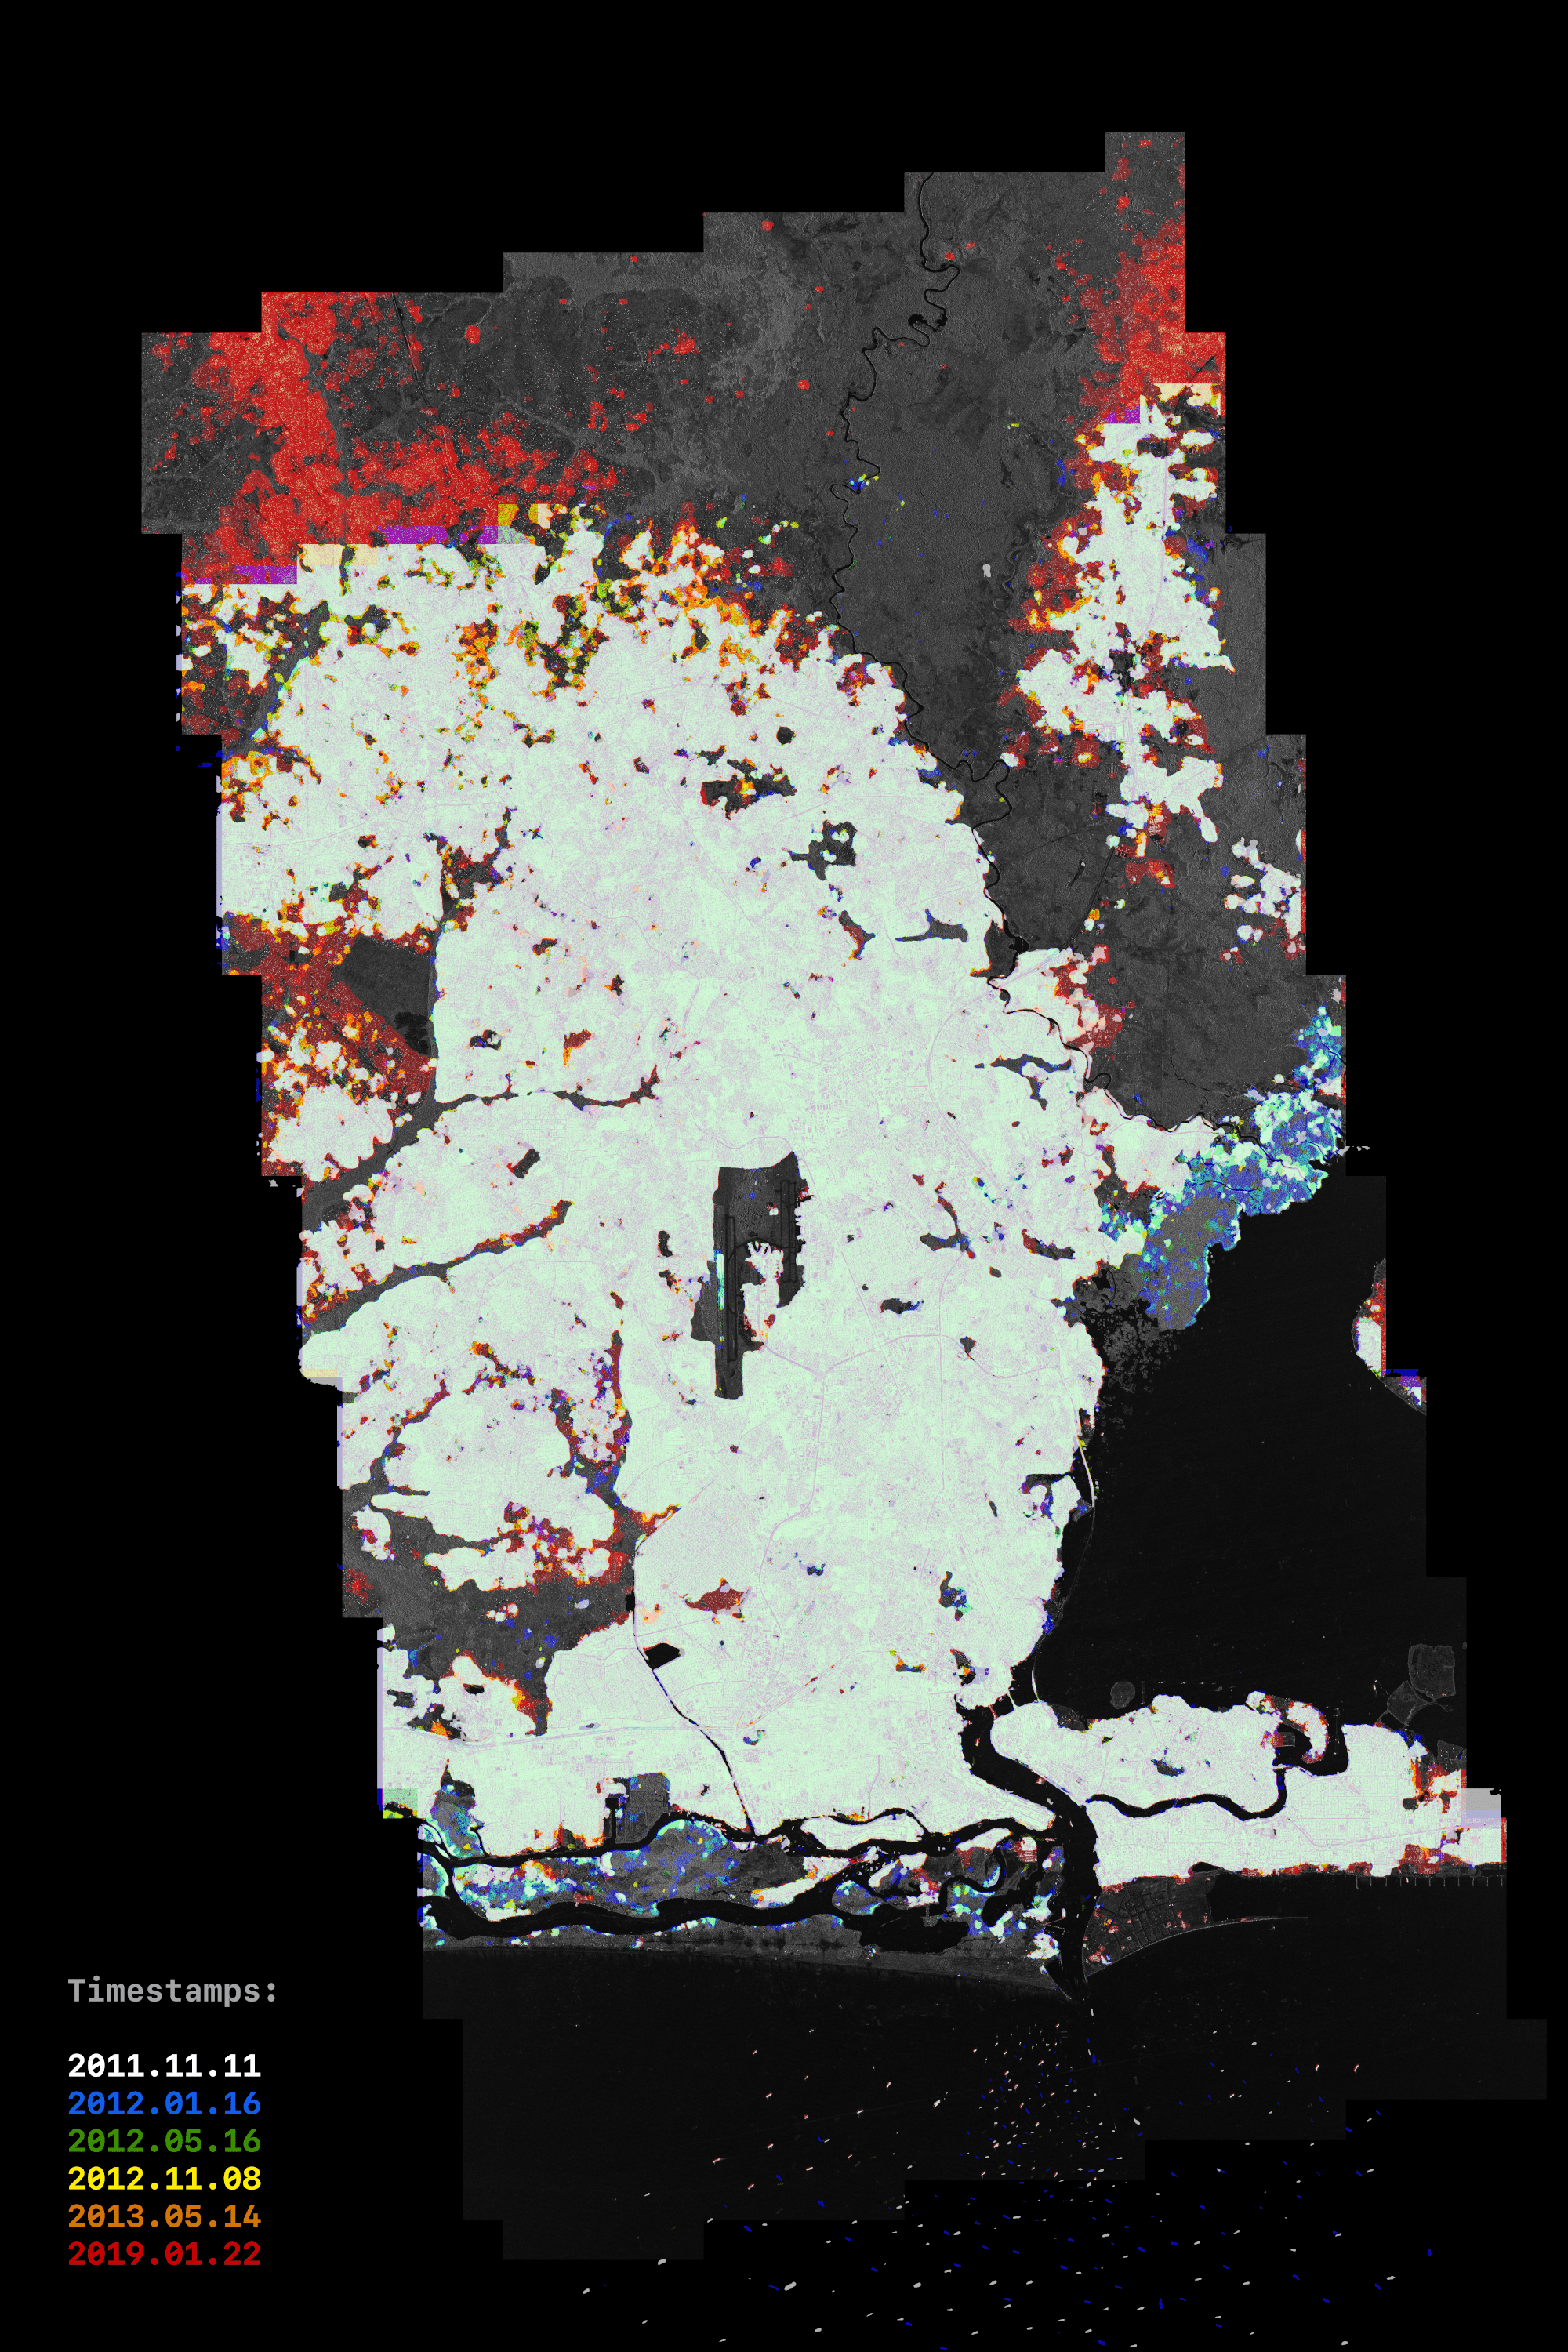
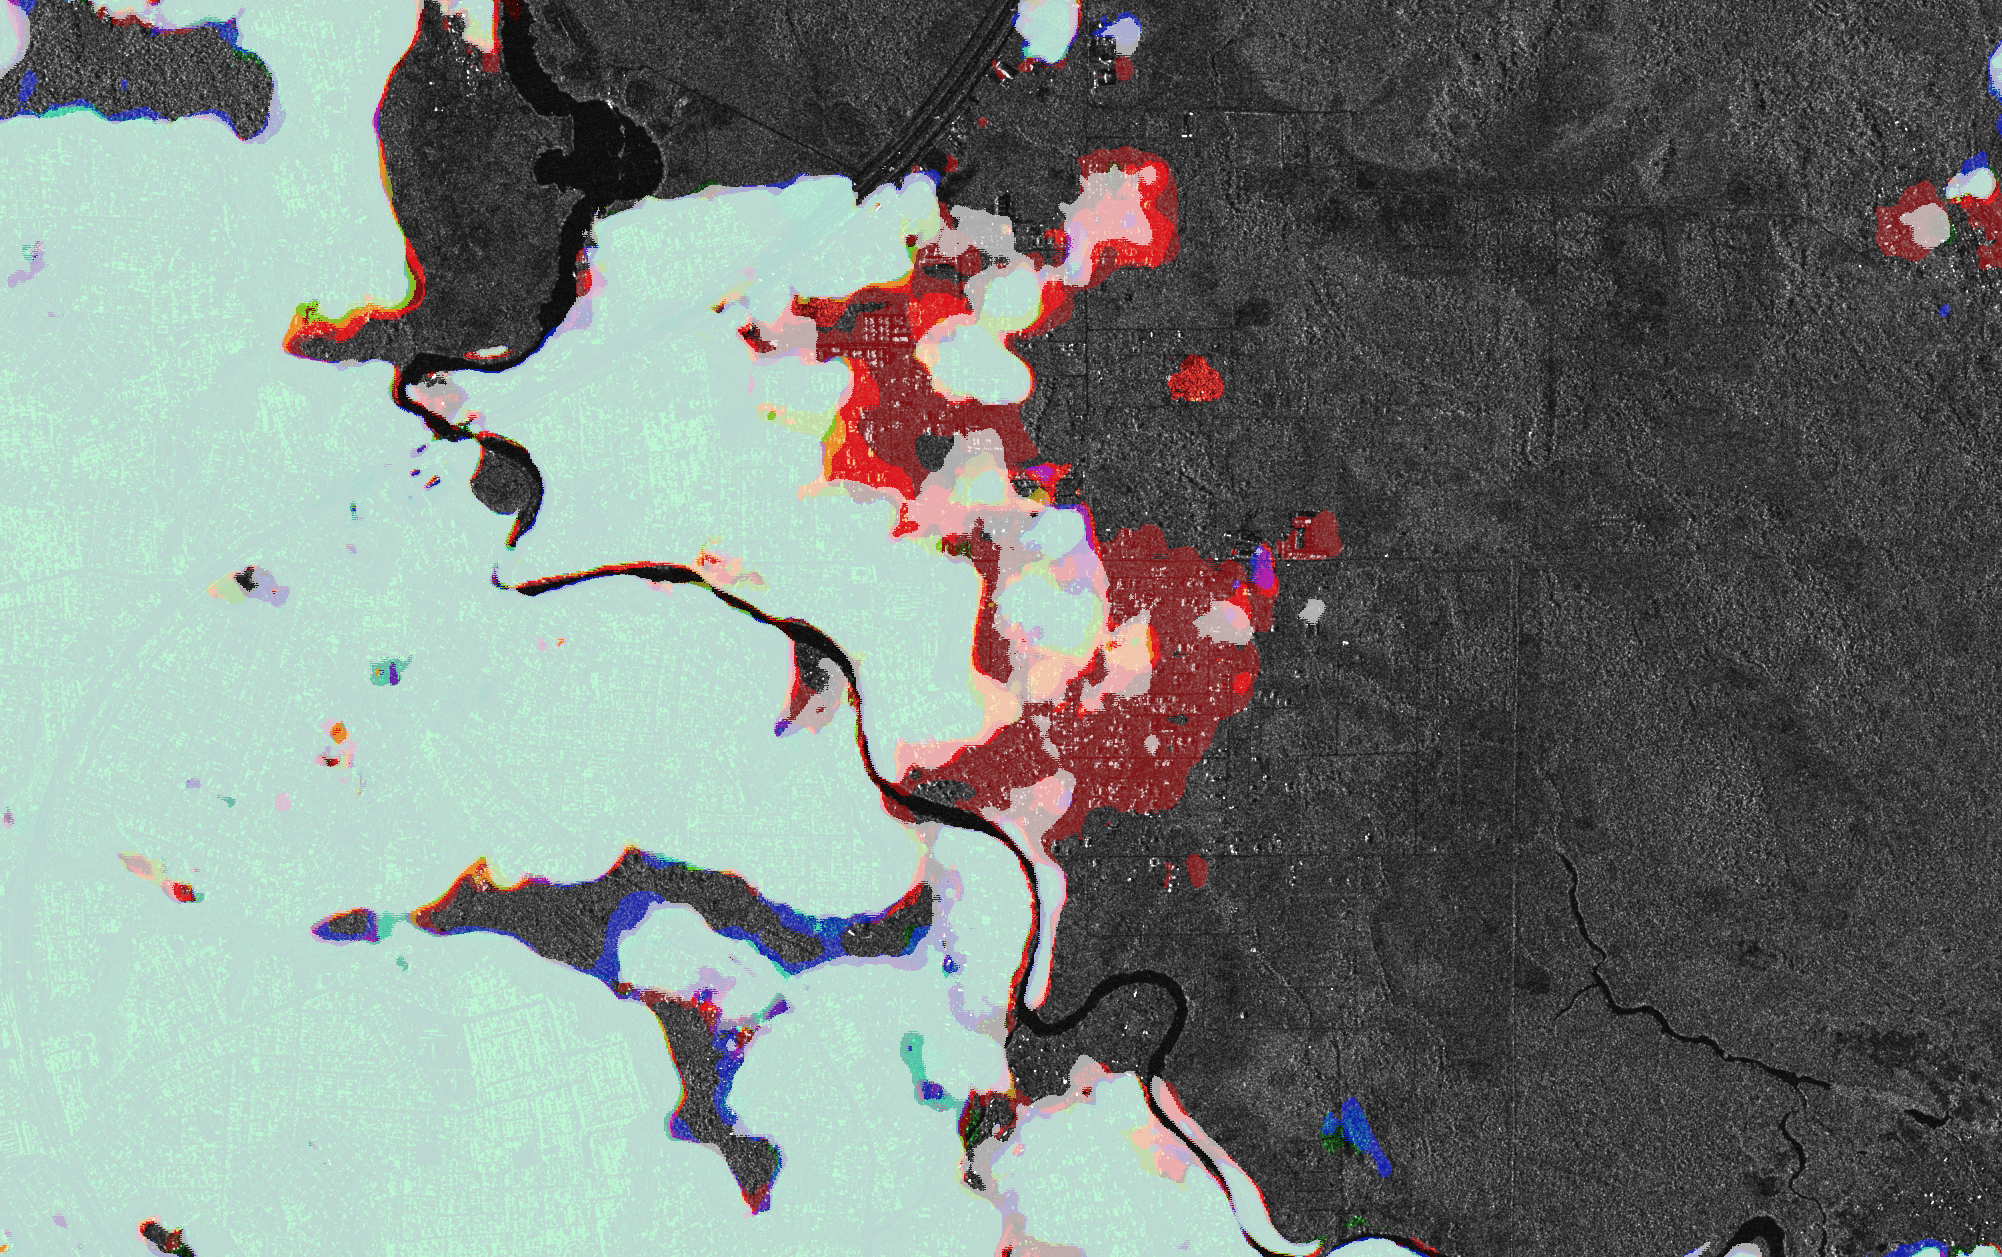
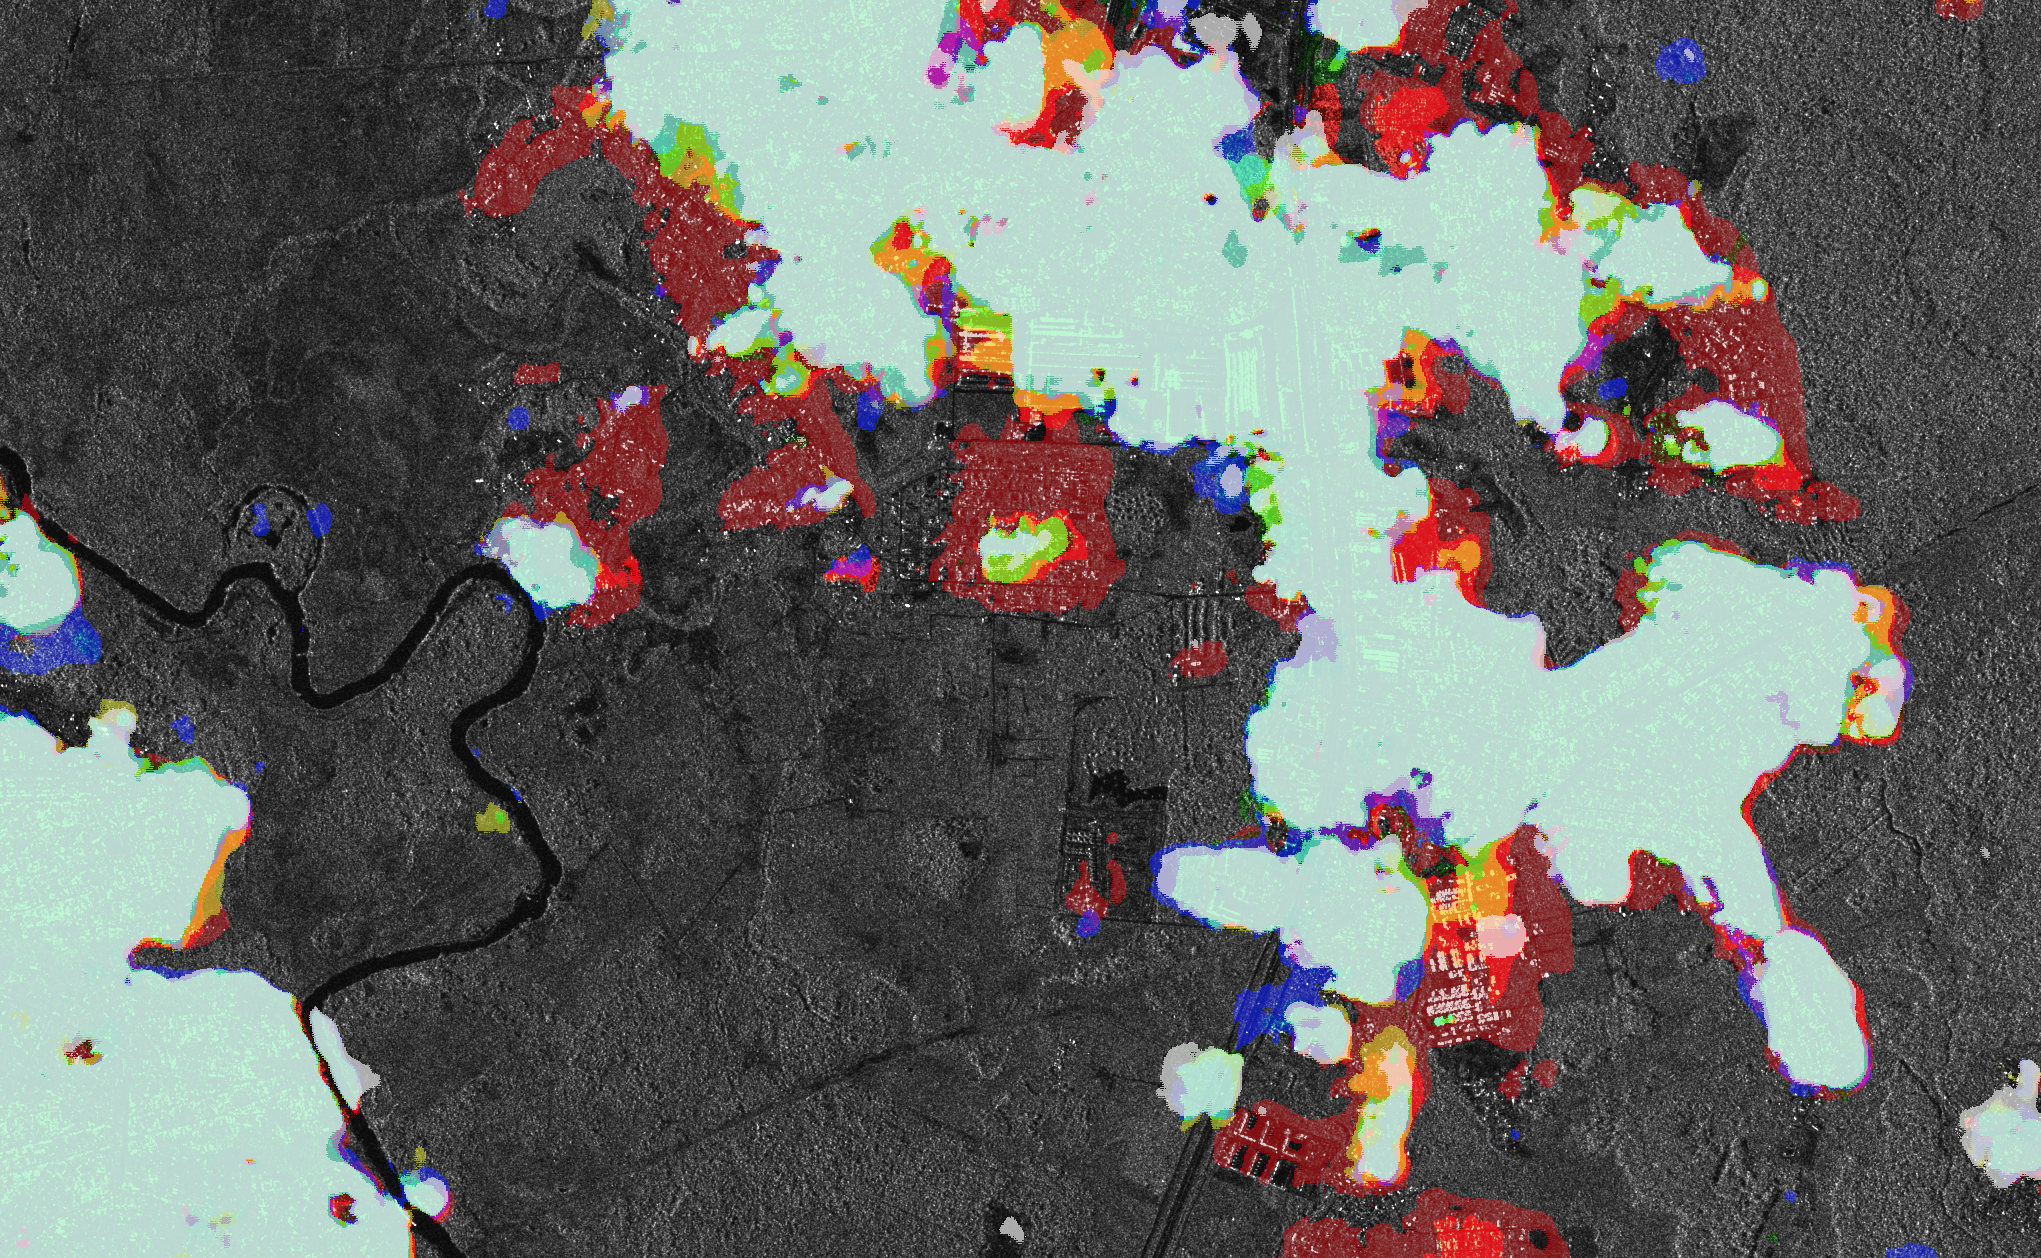
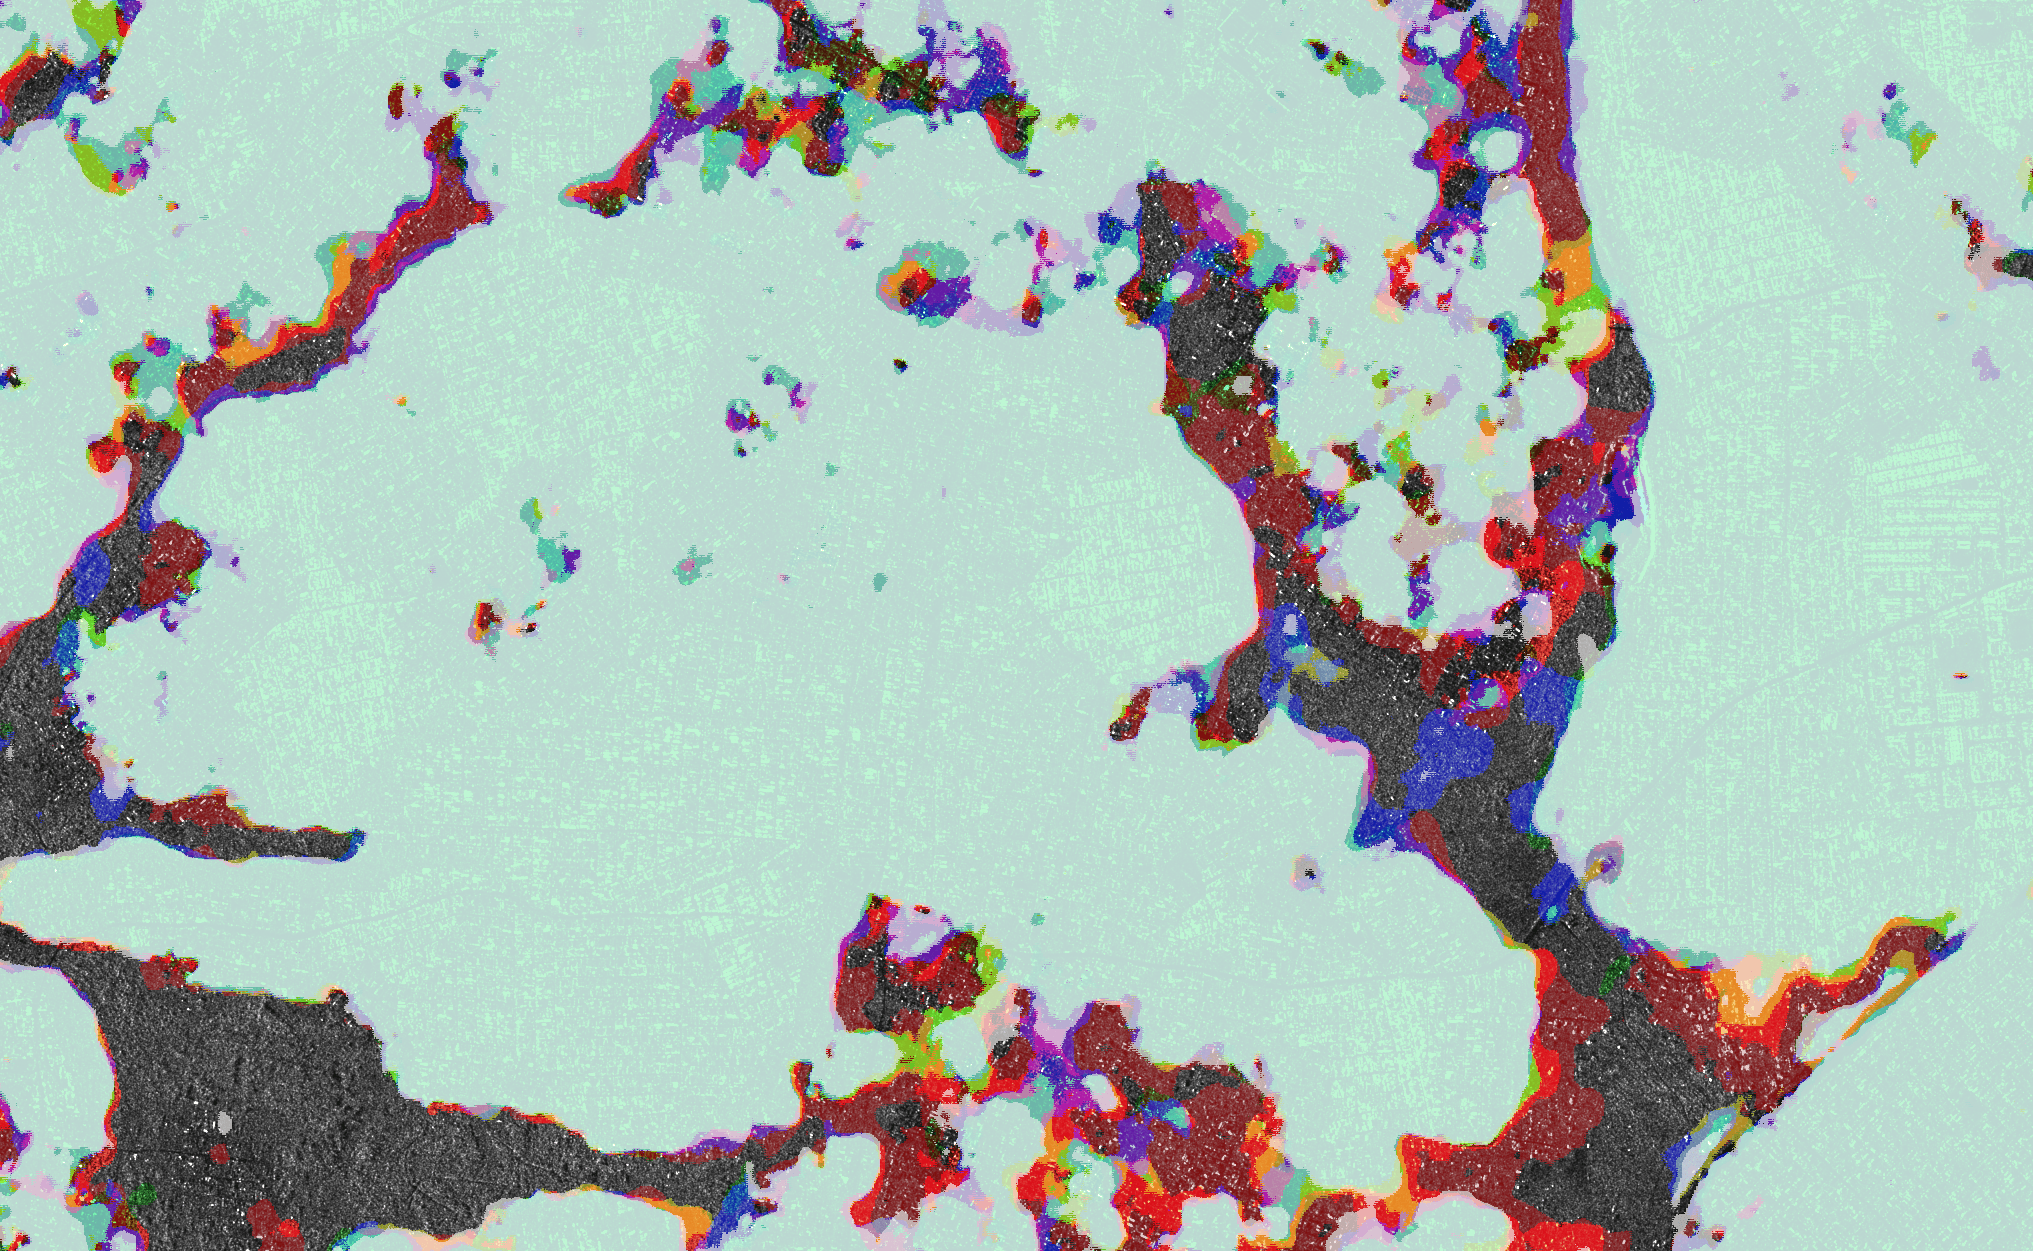
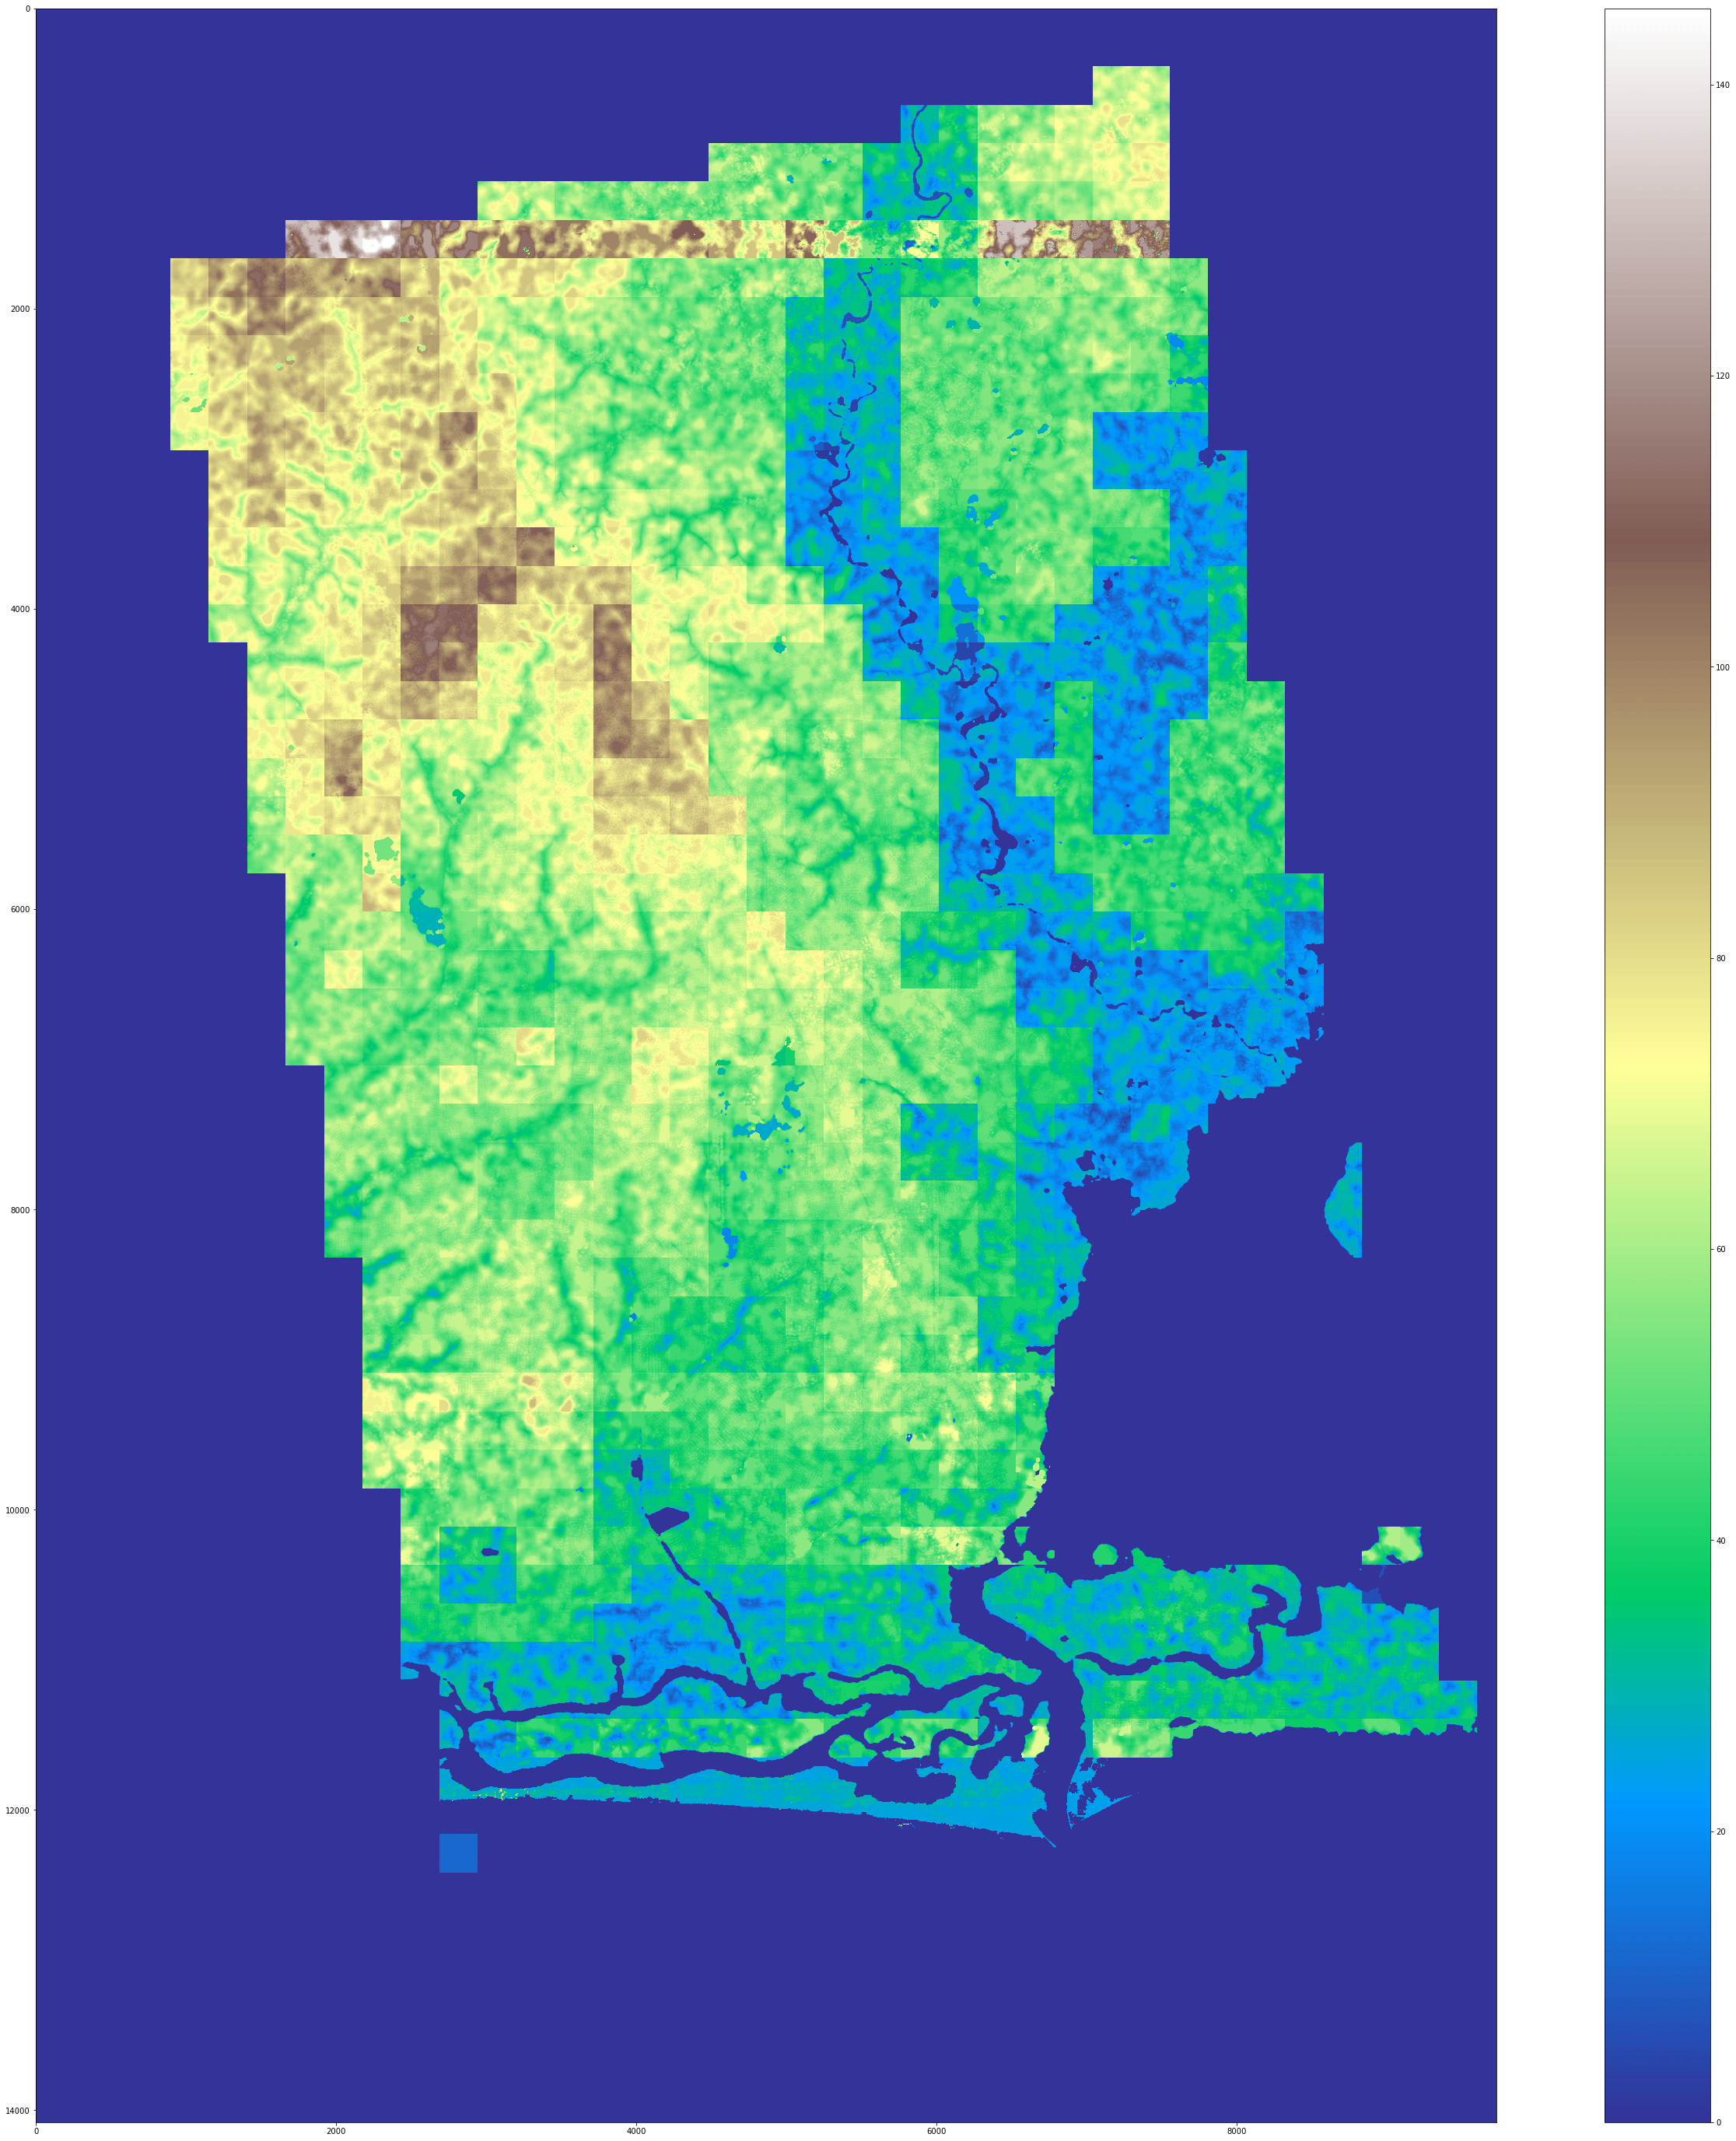
The images visualize the change in urban expansion of Lagos, Nigeria over time. The time steps range from white (2011) to red (2019) as newer and newer predictions have been made. The zoomed in images have the same timesteps as seen in the legend of the overview and are highlighting certain areas of new developments around Lagos.

Having trained the Im2Height-model in numerous different configurations, we draw a couple of conclusions from our results. Training using Structural Similarity Index Measure (SSIM) as the loss function, yield the best results in our experiments. Even though the model outputs some very large errors in some spots, they are often quite easily avoidable with the help of a simple anomaly detection as a post processing step. Using SSIM loss not only gave the best SSIM results (0.5 on training set, 0.03 on test set) in comparison to using the Mean Squared Error (MAE) loss (0.01 on training and 0.001 on test set), but removing the anomalies improves also results in a better MAE in our experiments (training: ±15m, test: ±18m vs ±18m and ±21m respectively).

However, these errors are still too large to meaningfully detect smaller changes happening over multiple years (most of which are expected to be well below that error size). Since these results differ from the original paper, we want to outline a few possible reasons for this outcome: the low resolution of the radar data is the most likely source of this error (5x5m compared to 0.7x0.7m in the original paper) which in combination with the lack of visual clues such as shadows, etc. drastically decimate the possibility to learn from the data. Below in the gallery are some visual outputs of the predictions made by Im2Height.

The images above visualise, from left to right, the absolute elevation, the error size of the predictions and lastly the predicted difference between 2011 and 2019. All images are taken from Lagos, Nigeria.


Conclusion


In conclusion: the U-Net can reliably detect horizontal spread of urban areas with high accuracy using TerraSAR-X radar data as input. The Im2Height on the other hand wasn't able to produce satisfying results using radar data as input at this stage. We would need to further investigate whether radar data even at higher spatial resolution is sufficient, or if visible spectrum data is the only choice available. Additionally, to evaluate if a minimum resolution threshold exists, above which the model would start to perform well regardless of data source, has to be further explored. Regardless, this feasibility study has been both challenging and educational, we have gathered new knowledge that we take with us moving forward with this and other projects. We want to thank ESA for supporting us in executing this project and allowing us to explore new applications within remote sensing using machine learning.