Automatic Planning of Solar Systems


Creative solutions enabled us to automate the process of planning solar systems.

Input

The address and a photo of the roof of a customer's house

Output

Roof dimensions, roof angle, southern orientation, number of solar panels, panel visualisation

Goal

Accelerate the planning process


Introduction


Our client is a company from the solar sector, which offers the planning, consultation, and installation of solar systems for private households. The aim of this project is to automate the planning process of solar systems. Specifically, this involves preparing an individual offer for customers so that they can estimate the costs and benefits of the investment and get an aesthetic impression of the final result.


Starting Point


Our client, Enpal, offers the planning, consultation, and installation of solar systems for private households. The aim of this project is to automate the planning process of solar systems. Specifically, this involves preparing an individual offer for customers so that they can estimate the costs and benefits of the investment and get an aesthetic impression of the final result.

The old process is very manual. It required an employee to...

  1. Use a roof photo to manually draw the roof circumference and the contours of each obstacle

  2. Count the number of roof tiles on Google Maps to determine the roof size

  3. Use desktop software to estimate the roof angle and area

  4. Create a visualization of the solar panels

The whole process takes on average 120 minutes per planning, is error-prone (unclear calculation methods, frequent manual interfaces) and the visualization of the solar panels on the house roof does not match current standards.


Challenges


The goal of the project was clearly defined: Significantly accelerate the planning process.

But in detail, there were many challenges, such as

  • Should we aim for a solution for all roof shapes? Which data sources should be used?

  • Which human-machine interfaces are optimal in the conflicting areas of planning quality vs. time savings vs. user-friendliness?

  • How does the solution scale for several users? Does the system run in the cloud or on the user's computer?


Solutions


We developed our solution within an agile project framework (MVP after 6 months, continuous user feedback). The entire process was automated up to the visualization of the solar panels.

Together with the customer's IT department, the solution was implemented as a web application, which has several advantages:

  • fast roll-out of improvements

  • unlimited user addition

  • operating system independence, etc.

Currently, 13 employees are working with our software (June 2019). The use of the old solar software has been discontinued.

The planning time was reduced from 120 minutes to approx. 15 minutes.

See the video below to get an impression of the workflow.


Technical Background


Background: The Old Process

Until now, the solar systems were planned with the help of a desktop application, which is only available for Windows, has an outdated GUI as well as high maintenance and license costs. Furthermore, there are no interfaces (both for automatic reading of customer information as well as for passing on new information) and the usability is not optimized for the use case (many unnecessary clicks/steps).

For cases where the roof angles and roof dimensions are unknown to the customer, the application has an approximative triangulation method, which estimates the roof angle using the roof circumference drawn on a photo and the input of a reference length (e.g. roof width, roof length). However, this method often turned out to be incorrect. Since the application is not open source and there is no transparent description of the calculation method, this error can not be sufficiently analyzed and the method can not be improved.

The Old Process in Detail

In order to prepare a quotation, our client first needs various information from the customer, such as the length and width of the roof, roof orientation, etc. Usually, parts of this data are unknown to the homeowner and an employee ('Chris') has to find the information elsewhere.

  1. Chris creates a new project in a desktop solar software and asks the homeowner for a photo of the roof.

  2. He then enters this photo and the customer's data into the solar software.

  3. Now the roof circumference and the contours of each obstacle on the roof must be drawn in manually. Dormers are treated separately since these usually take up more roof surface area on the photo than in reality.

  4. Now Chris adds a reference length (e.g. the length or width of the roof). Therefore he opens the browser and enters the customer address e.g. at Google Maps. If the quality of the satellite image is good enough, Chris counts the roof tile on the roof and the reference length is roughly determined. Otherwise, he has to switch to another service.

  5. After entering the reference length, the program estimates the roof angle and the resulting roof area. This often leads to inaccuracies. Since the underlying calculation method is not transparent, a subsequent improvement is hardly possible.

  6. After a few further steps, Chris saves the desired solar panel visualization and transfers it (including further offer-relevant data) to the software so that a final offer can be created.

Our Solution

Available input: address and roof photo of the customer.

Desired output: roof dimensions, roof angle, southern orientation, number of solar panels, panel visualization on the customer's roof picture.

The biggest challenges we were able to identify before the project started, were the following:

  1. recognition of small obstacles (chimney, skylight, antenna, etc.)

  2. different input quality (e.g. shading)

  3. estimating (3-dimensional) roof dimensions (length, width, roof angle)

  4. handling of special roof shapes

  5. separation of different roof sides

  6. interfaces (man-machine, machine-machine)

Technologies Used

Backend: Python, Tensorflow, PyTorch, SciPy, NumPy, scikit-learn, scikit-image, OpenCV, Flask

Frontend: JavaScript, Angular5, Three.js, Fabric.js, Sass

Infrastructure: GCloud, Docker, Git

In the following, we present solutions to some selected problems.

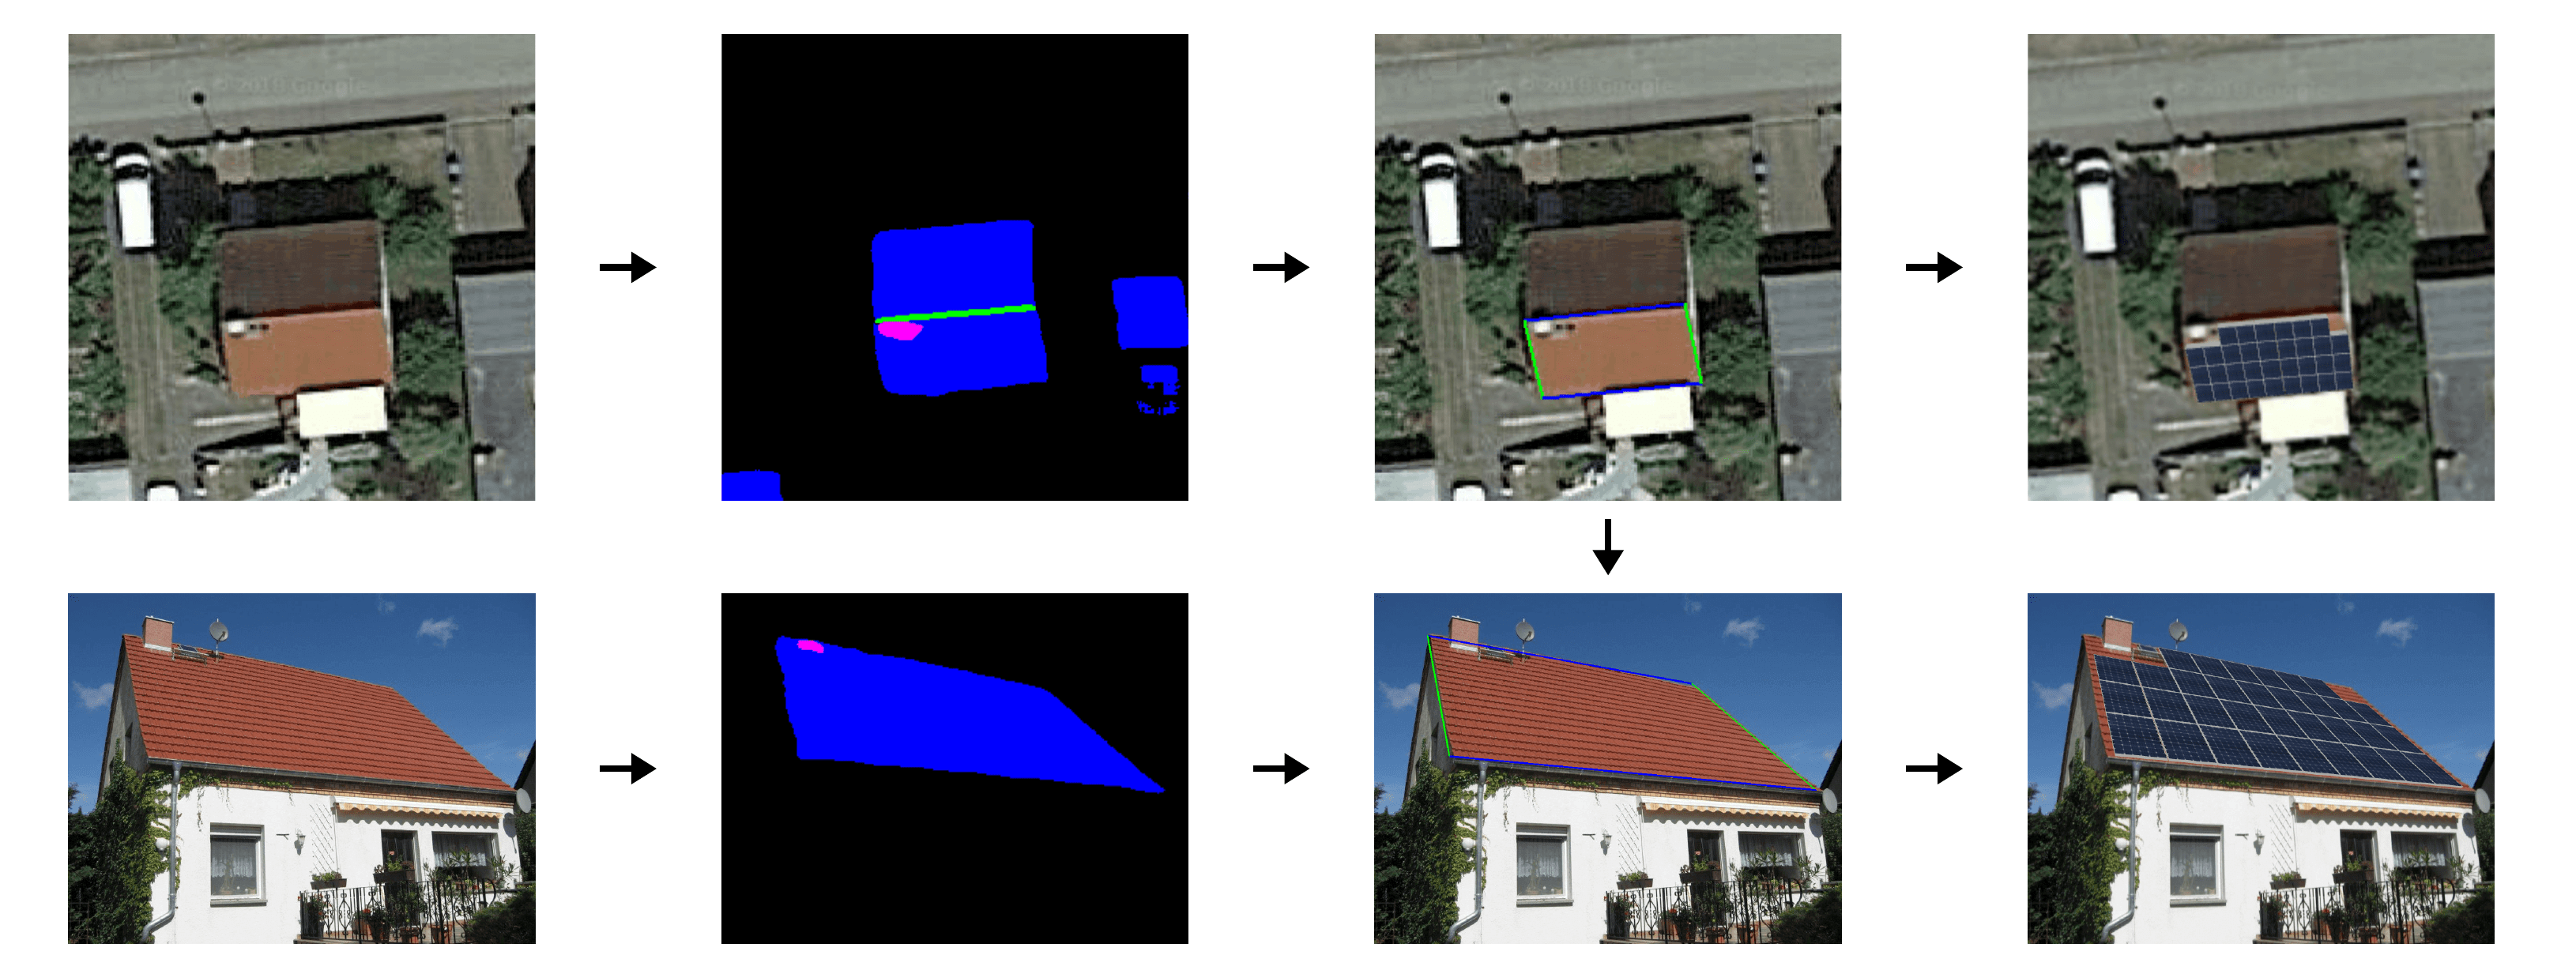
1. Segmentation of the roof

We segment the roof and the obstacles on it by means of neural networks both on the satellite photo and on the customer photo. The architecture of these networks is mainly based on U-Nets, a specific form of a convolutional neural network, which currently provides the best performance for such problems.

For the training of the nets, we generated numerous labels ourselves, i.e. marked outlines of roofs and obstacles. It was important to adapt the labeling scheme to the problem in order to learn and finally recognize small obstacles and semantic structures.

The training required extensive finetuning (e.g. identification of the best loss function, data augmentation, hyperparameter optimization, etc.) - for details please refer to our Blog.

For the segmentation of customer photos, we were able to achieve significant improvements by means of transfer learning through a neural network pre-trained on ImageNet. The two lower pictures exemplify the impressive abilities of the neural network we trained to recognize semantic structures.

The net correctly estimates the base area of the dormer.
The net recognizes that both the roof and a small corner of the roof window are 'hidden' behind the parasol.

2. Postprocessing

The segmentation of the roofs first provides a pixel-by-pixel classification (i.e. each pixel is assigned to a class = {roof, non-roof, obstacle, etc.}). The next step is the detection of geometric shapes and the recognition of semantic structures. In particular, it is about the recognition of the roof corners, the separation of individual roof parts, and the identification of the respective south side.

These subtasks turned out to be more difficult than initially assumed due to the not always perfect segmentation output. Through a creative combination of evolutionary algorithms and classical computer vision methods, we still achieve very good quality and are able to correct segmentations of lower quality.

Red dots: Not quite correctly recognized perimeter of the roof area, blue lines: Estimated roof perimeter after postprocessing.

3. Inferring the roof dimensions

Photos are 2-dimensional projections and therefore not quite sufficient for estimating the actual roof area.

We solved this problem by a combination of satellite and customer photos. The former provides reference dimensions for horizontal distances and the latter allows us to calculate angles for rectangular roof surfaces using projective geometry and self-developed formulas.

With the help of simple trigonometric formulas, we then determine length and width and thus the area of the roof. The transformation matrix obtained from the formulas allows the visualization of the panels on the customer photo.

Projective geometry allowed us to calculate the roof surface areas

We would be happy to present more detailed information to you in a personal meeting.

Related projects